
Škoda cars are the most in the Czech Republic, so it is not surprising that these domestic cars appear in the first ranks in the statistics, not only in terms of sales, but also in terms of accidents. However, this does not mean that Škoda Auto cars, i.e. their drivers, are the most dangerous.
It is necessary to compare the culprits of traffic accidents by brand with the number of vehicles in operation in the motor vehicle register, which will then show which drivers are statistically the most dangerous. And yes, they are usually the ones with high mileage.
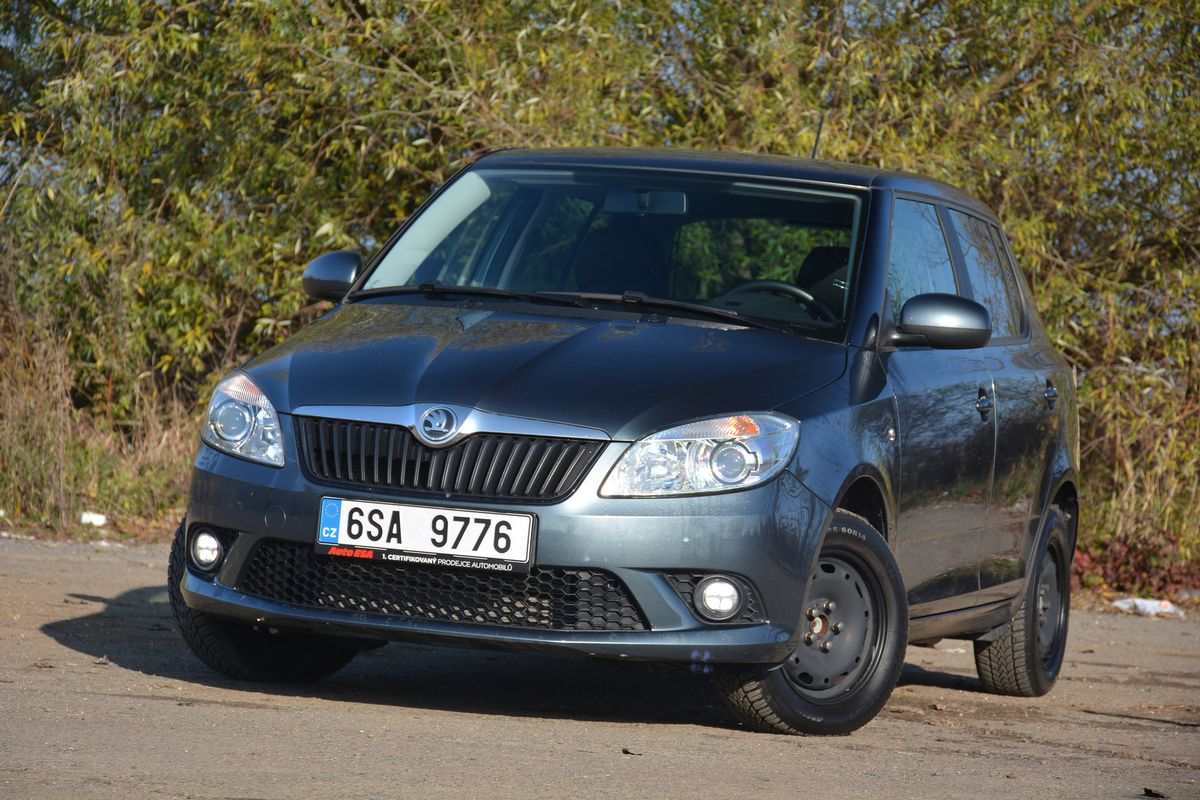
Photo: Dalibor Žák
Škoda drivers caused the most accidents last year, but they drive the most.
But pretty much in order, so let’s first look at what the table of the top 25 culprits of domestic traffic accidents looks like in terms of the number of at-fault collisions by manufacturer.
| Factory brand | Accidents at fault |
|---|---|
| SKODA CAR | 14 915 |
| VOLKSWAGEN | 6 157 |
| FORD | 3 737 |
| MERCEDES | 3 303 |
| RENAULT | 2 759 |
| PEUGEOT | 2 521 |
| BMW | 2 171 |
| HYUNDAI | 1 827 |
| CITROËN | 1 614 |
| OPEL | 1 614 |
| AUDI | 1 578 |
| TOYOTA | 1 448 |
| IVECO | 1 420 |
| FIAT | 1 357 |
| VOLVO | 1 252 |
| KIA | 903 |
| HONDA | 889 |
| MAN | 880 |
| DACIA | 860 |
| OTHERS MADE OUTSIDE THE CR | 852 |
| DAF | 769 |
| SEAT | 738 |
| SUZUKI | 697 |
| STEYR-DAIMLER-PUCH | 642 |
The second top 25 table will tell us about the potential danger, as we will compare the numbers with the data of the vehicles in operation from the motor vehicle register, which gives us the percentage danger of the given brand.
| Factory brand | Danger |
|---|---|
| DAF | 4,60 % |
| MAN | 3,10 % |
| IVECO | 2,90 % |
| MERCEDES | 1,50 % |
| VOLVO | 1,30 % |
| AUDI | 1,10 % |
| BMW | 1,00 % |
| RENAULT | 0,90 % |
| FIAT | 0,90 % |
| VOLKSWAGEN | 0,80 % |
| FORD | 0,80 % |
| PEUGEOT | 0,80 % |
| OPEL | 0,80 % |
| TOYOTA | 0,80 % |
| SKODA CAR | 0,70 % |
| HYUNDAI | 0,70 % |
| CITROËN | 0,70 % |
| DACIA | 0,70 % |
| SEAT | 0,70 % |
| KIA | 0,60 % |
| HONDA | 0,50 % |
| SUZUKI | 0,50 % |
| OTHER OUT OF CZ | unavailable data |
| STEYR-DAIMLER-PUCH | unavailable data |
It is quite clear from the available data that the most dangerous are drivers of brands that also offer a full range of commercial vehicles, including medium- and heavy-duty trucks, or buses. And these cars usually have high mileage.
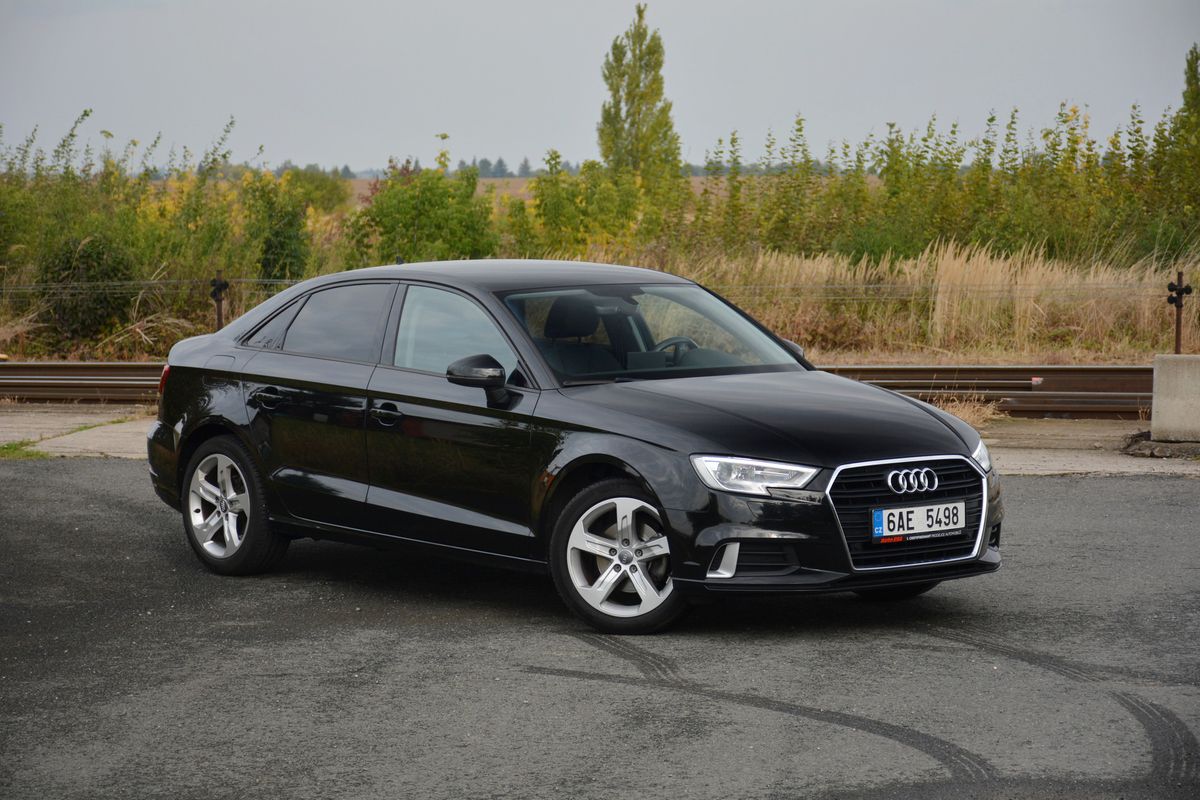
Photo: Dalibor Žák
From purely passenger cars, they emerged as the most dangerous drivers of Audi cars.
From the point of view of purely passenger cars, Audi and BMW drivers are the worst off, as they have also overtaken Renault and Fiat, which are also important brands from the point of view of commercial vehicles.
Regions and years of production
No less interesting are the data on how crashes occurred in individual regions, more specifically in which regions were the most guilty of traffic accidents caused by a motor vehicle.
| End | Number of closed accidents |
|---|---|
| Prague | 13 444 |
| Central Bohemia | 12 076 |
| Moravian-Silesian | 7 990 |
| Ústí | 7 230 |
| South Moravian | 5 205 |
| Olomouc | 4 244 |
| South Bohemian | 4 229 |
| Pilsen | 4 089 |
| Liberecký | 3 844 |
| Královéhradecky | 3 723 |
| Pardubice | 3 337 |
| Zlínský | 3 274 |
| Highlands | 3 008 |
| Karlovy Vary | 2 423 |
Here again, it is not surprising that the majority of accidents involving a motor vehicle occurred in Prague and in the Central Bohemian and Moravian-Silesian regions, as these are really large/populous regions. Therefore, expect an increased risk in the Ústecký region.
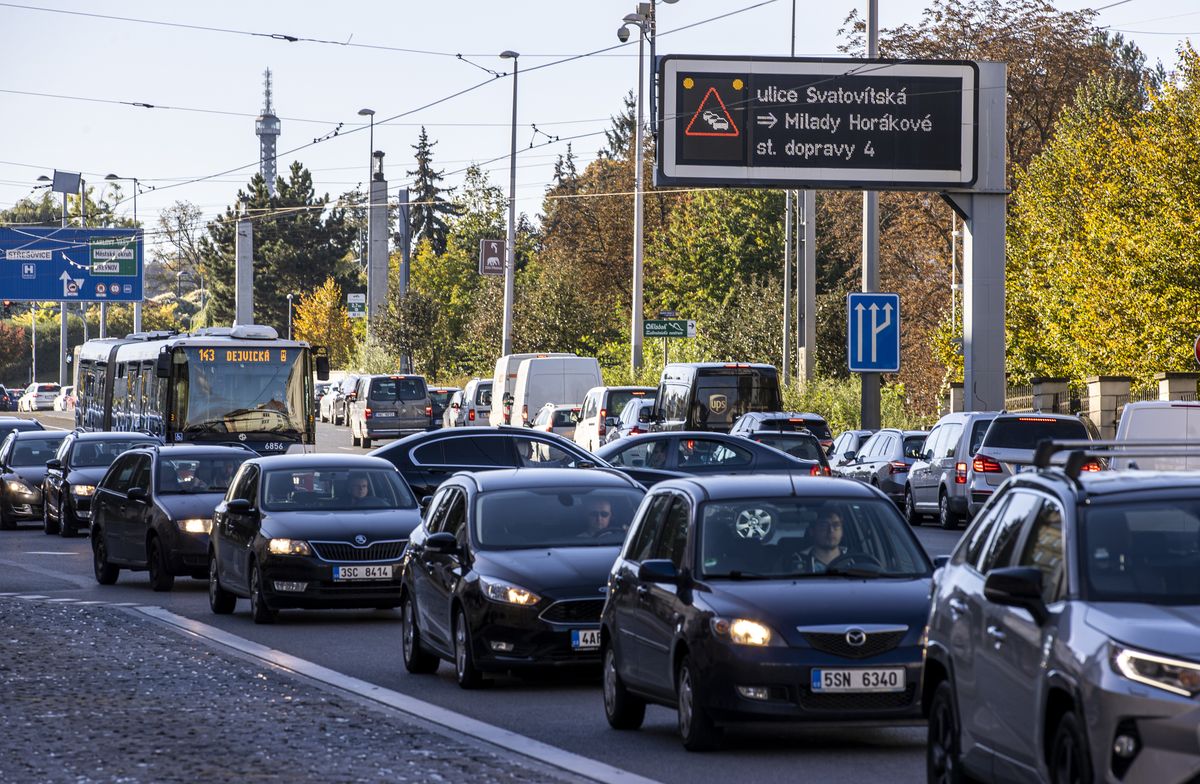
Photo: Michal Turek, Seznam Zpravy
Prague at the top, behind it the Central Bohemian region. Considering the traffic and the number of drivers, there is nothing to be surprised about.
The last data overview of the top 25 will show us how old vehicles the culprits of the accidents were sitting in, however, here the statistics are a bit distorted by the fact that the largest number has the item “undetermined”, when the year of manufacture of the culprit’s vehicle was not detected/recorded.
| Year of manufacture of the culprit’s vehicle | The number of accidents |
|---|---|
| unspecified | 14 853 |
| 2007 | 2 913 |
| 2019 | 2 838 |
| 2008 | 2 822 |
| 2006 | 2 795 |
| 2018 | 2 719 |
| 2017 | 2 645 |
| 2021 | 2 634 |
| 2005 | 2 586 |
| 2016 | 2 505 |
| 2022 | 2 435 |
| 2015 | 2 387 |
| 2004 | 2 367 |
| 2020 | 2 342 |
| 2009 | 2 313 |
| 2010 | 2 261 |
| 2003 | 2 256 |
| 2011 | 2 185 |
| 2012 | 2 081 |
| 2023 | 2 026 |
| 2014 | 1 983 |
| 2013 | 1 886 |
| 2002 | 1 882 |
| 2001 | 1 856 |
| 2000 | 1 544 |
The data also tells us that accidents caused by the driver of a motor vehicle are more likely to be caused by drivers of older vehicles and young vehicles around five years old. Although they did not fit into the top twenty-five, drivers of cars manufactured in 1993 and below are responsible for the absolute minimum number of crashes.
Please take the published data with a cool head and certainly do not panic as soon as you see a DAF, MAN or Iveco passing by. After all, these are small percentage risks. However, keep your eyes peeled in traffic, because transportation by any means of transport on land is one of the more dangerous globally…


